[Extracted from] [1912] LEICESTER: SANITATION versus VACCINATION BY J.T. BIGGS J.P.
CHAPTER 49. THE GENERAL DEATH-RATE OF LEICESTER.
WE may now merge the details of the several tables already given into the general death-rate, or, more correctly, the death-rate of Leicester from all causes and at all ages. These results are equally as significant as those of a more detailed character. From 1868 to 1872, when the percentage of vaccination reached high-water mark, the average annual death-rate of Leicester was 27 per thousand of the population per annum, or nearly five per thousand above the annual average death-rate of England and Wales.
Had the death-rate of Leicester continued in 1908-10 at the same alarming figure as in the high vaccination period of 1868-72, the deaths each year would have reached an annual average of about 6,400, instead of being only 3,026, and thus showing an annual saving of nearly 3,400 lives.
Fortunately, owing to its sanitary advancement, the death-rate of Leicester in 1908-10 was nearly two per thousand below that of England and Wales, or a gain on the death-rate of the whole country, as compared, with 1868-72, of exactly 6.4 per thousand. Had the death-rate of Leicester even only remained in the same relative position to England and Wales as in 1868-72, there would have been, in each of the three years named, about 2,540 more deaths than actually occurred. In other words, instead of an average annual death-rate of 3,026. there would have been no less than 5,560 deaths in each of these years. On this basis an annual saving of 2,534 lives has resulted. Whether we take the annual saving at nearly 3,400 lives, or over 2,500, it is an achievement to be proud of, and proves the enormous benefits Leicester has derived from its progressive sanitary policy and work.
TABLE 15. (See Graph B.)
Being Table 24, Royal Commission, Fourth Report, abbreviated by omitting the actual numbers, but continued to 1910.
Table showing, for the BOROUGH OF LEICESTER during the years 1838-1910, in quinquennial periods, the average annual rate per 1,000 living of persons married, of births, and of deaths; with the average annual registered vaccinations per 100,000 living.*
|
Periods |
Rate per
1,000 Population. |
Estimated Population for the middle of the Period. | Average Annual Registered Vaccinations per 100,000 Population. | ||
| Persons Married. | Births | Deaths | |||
| 1838-42 | 20.58 | 38.96 | 28.09 | 49,951 | not known |
| 1843-47 | 21.24 | 38.51 | 27.46 | 54,737 | returns incomplete |
| 1848-52 | 22.10 | 37.61 | 26.51 | 59,788 | 2,398 (4 yrs) |
| 1853-57 | 20.62 | 37.35 | 24.88 | 63,624 | 3,008 |
| 1858-62 | 20.30 | 37.15 | 24.48 | 67,456 | 2,434 |
| 1863-67 | 24.78 | 41.15 | 25.97 | 78,516 | *3,175 |
| 1868-72 | 22.38 | 41.60 | 26.82 | 92,873 | 3,819 |
| 1873-77 | 22.22 | 42.69 | 24.49 | 105,913 | 3,401 |
| 1878-82 | 19.22 | 39.74 | 22.17 | 120,059 | 2,645 |
| 1883-87 | 17.28 | 35.15 | 19.88 | 136,147 | 1,059 |
| 1888-92 | 16.79 | 32.12 | 18.34 | 161,911 | 108 |
| 1893-97 | 16.67 | 31.91 | 17.31 | 190,690 | 65 |
| 1898-02 | 17.20 | 29.82 | 16.75 | 208,627 | 241 |
| 1903 07 | 16.03 | 25.70 | 13.78 | 228,165 | 612 |
|
1908-10 (3 years) |
14.98 | 22.51 | 12.39 | 244,267 | 257 |
* For the actual number of annual vaccinations and extra vaccinations for 1863-64, see Table 50.
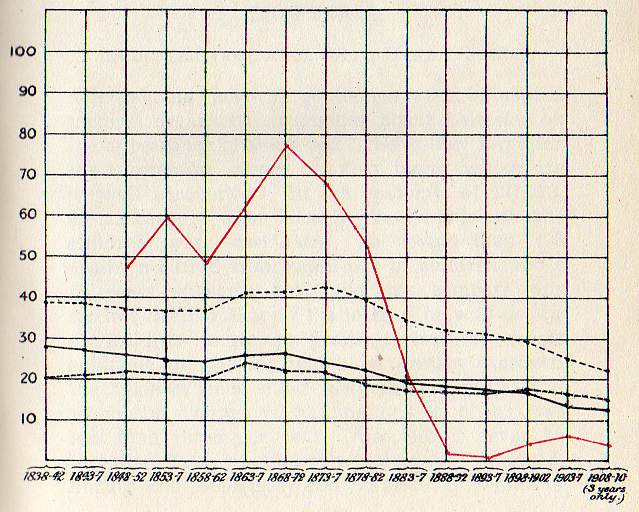
ILLUSTRATING TABLE 15.
LEICESTER.
MARRIAGES, BIRTHS. AND DEATHS, PER 1000 POPULATION, 1838—1910.
Upper Dotted Curve—Average annual birth-rate per 1000 population Solid Blank Curve—Average annual death-rate from all causes per 1000 population.
Lower Dotted Curve—Average annual number of persons married per 1000 population.
Red Curve---Average annual vaccinations per 100,000 population. (One-fiftieth only shown to suit compass of diagram.)