[Extracted from] [1912] LEICESTER: SANITATION versus VACCINATION BY J.T. BIGGS J.P.
TABLE 43. (See Graph H.) Being Table No. 20, Royal Commission, Fourth Report, continued to 1910.
Table showing, for the BOROUGH OF LEICESTER during the years 1838-1910, in quinquennial periods, the average annual death-rate from each of the seven principal zymotic diseases per million living, and the percentage of the deaths from each of those diseases to the deaths from all of them, with the average annual registered vaccinations to 10,000 births.*
| Smallpox | Measles | Scarlet Fever | Diptheria | Whooping Cough | Fevers | Diarrhoea | Totals | Average Annual Registered Vaccinations to 10,000 Births | ||
| 1838-42 | Per Million | 592 | 1,313 | 757 | 80 | 520 | 1,529 | 1,586 | 6,377 | Not known |
| Percentage | 9.3 | 20.6 | 11.9 | 1.2 | 8.1 | 24.0 | 24.9 | 100 | ||
| 1843-47 | Per Million | 679 | 983 | 727 | 36 | 563 | 1,260 | 1,938 | 6,186 | Returns incomplete |
| Percentage | 11.0 | 16.0 | 11.2 | 0.6 | 9.1 | 20.6 | 31.5 | 100 | ||
| 1848-52 | Per Million | 522 | 719 | 800 | 34 | 565 | 1,352 | 2,201 | 6,193 |
6,278 (4 years) |
| Percentage | 8.4 | 11.6 | 12.9 | 0.5 | 9.1 | 21.8 | 35.7 | 100 | ||
| 1853-57 | Per Million | 91 | 688 | 531 | 57 | 355 | 1,267 | 2,276 | 5,265 | 8,018 |
| Percentage | 1.7 | 13.1 | 10.1 | 1.1 | 6.7 | 24.0 | 43.3 | 100 | ||
| 1858-62 | Per Million | 175 | 723 | 685 | 65 | 626 | 744 | 1,598 | 4,616 | 6,594 |
| Percentage | 3.8 | 15.7 | 14.9 | 1.4 | 13.5 | 16.2 | 34.5 | 100 | ||
| 1863-67 | Per Million | 316 | 497 | 866 | 46 | 502 | 609 | 2,374 | 5,210 | 7,694 |
| Percentage | 6.1 | 9.5 | 16.7 | 0.8 | 9.6 | 11.7 | 45.6 | 100 | ||
| 1868-72 | Per Million | 773 | 868 | 855 | 84 | 482 | 629 | 3,161 | 6,852 | 9,174 |
| Percentage | 11.3 | 12.7 | 12.5 | 1.2 | 7.0 | 9.2 | 46.1 | 100 | ||
| 1873-77 | Per Million | 17 | 425 | 765 | 78 | 557 | 434 | 2,507 | 4,783 | 8,004 |
| Percentage | 0.4 | 8.9 | 16.0 | 1.6 | 11.6 | 9.0 | 52.5 | 100 | ||
| 1878-82 | Per Million | 13 | 606 | 820 | 92 | 518 | 243 | 1,991 | 4,283 | 6,668 |
| Percentage | 0.3 | 14.2 | 19.3 | 2.1 | 12.0 | 5.7 | 46.4 | 100 | ||
| 1883-87 | Per Million | 4 | 373 | 464 | 71 | 380 | 165 | 1,734 | 3,191 | 2,988 |
| Percentage | 0.1 | 11.7 | 14.5 | 2.2 | 12.0 | 5.1 | 54.4 | 100 | ||
| 1888-92 | Per Million | 7 | 460 | 127 | 72 | 383 | 156 | 1,235 | 2,440 | 340 |
| Percentage | 0.3 | 18.8 | 5.2 | 3.0 | 15.7 | 6.4 | 50.6 | 100 | ||
| 1893-97 | Per Million | 17 | 335 | 259 | 201 | 357 | 201 | 1,627 | 2,997 | 210 |
| Percentage | 0.6 | 11.2 | 8.6 | 6.7 | 11.9 | 6.7 | 54.3 | 100 | ||
| 1898-02 | Per Million | 5 | 369 | 125 | 755 | 279 | 109 | 1,189 | 2,831 | 820 |
| Percentage | 0.2 | 13.1 | 4.4 | 26.7 | 9.9 | 3.8 | 41.9 | 100 | ||
| 1903-07 | Per Million | 23 | 262 | 131 | 78 | 264 | 48 | 848 | 1,654 | 2,352 |
| Percentage | 1.4 | 15.8 | 7.9 | 4.7 | 16.0 | 2.9 | 51.3 | 100 | ||
| 1908-10 (3 years) | Per Million | 0 | 397 | 92 | 46 | 182 | 31 | 405 | 1,153 | 1,140 |
| Percentage | 0.0 | 34.5 | 8.0 | 4.0 | 15.8 | 2.7 | 35.0 | 100 |
* For the actual number of annual vaccinations and the extra vaccinations, 1863-64, see Table 50.
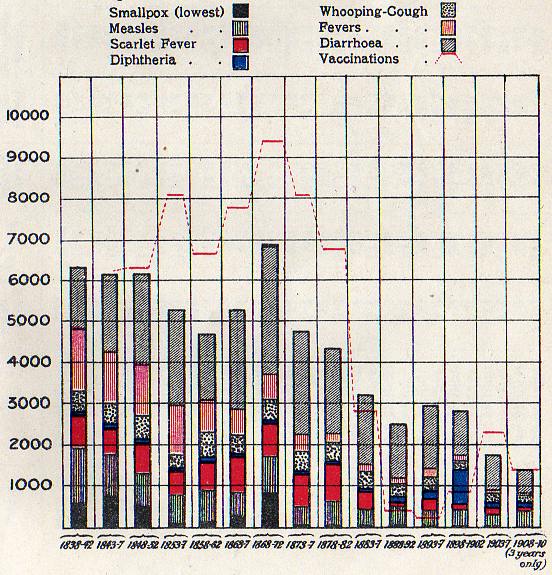
GRAPH H.
ILLUSTRATING TABLE 43. (see. Appendix). LEICESTER—ZYMOTIC MORTALITY. 1838—1910.
This Graph shows :—
(1) The average annual death-rate per million population from
the seven principal zymotic diseases, with the relative proportion of deaths
from each disease, in quinquennial periods 1838-1910.
(2) The average annual registered vaccinations to 10,000 births.
(3) An unprecedented increase of zymotic mortality coincident
with the highest vaccination period 1868-72; and
(4) A marked decline of zymotic mortality also coincident with
the decline and practical abandonment of vaccination
subsequent to 1872.