[Extracted from] [1912] LEICESTER: SANITATION versus VACCINATION BY J.T. BIGGS J.P.
TABLE 49.
(See Graph J.)
Being Table 44, Royal
Commission, Fourth Report, abbreviated by
omitting the average annual number of deaths for the respective periods, but
extended by the inclusion of the death-rate per 1,000 births and of those living
over one year of age, and carried to 1910.
Table showing, for the BOROUGH OF LEICESTER during the years 1838-1910, in quinquennial periods, the average annual death-rate from all causes per 1,000 living at all and under and over certain ages, and the average annual percentage of registered vaccinations to births.*
| Period | Under One Year | Over One Year | Under Five years | Over Five Years |
Under 10 years |
Over 10 Years |
Under 15 Years |
Over 15 Years | Totals for All Ages |
Annual Average Percentage of Vaccinations to Total Births |
| 1838-42 | 177.03 | 22.03 | 90.23 | 18.55 | 52.91 | 19.81 | 39.22 | 21.94 | 28.09 | Not known |
| 1843-47 | 192.89 | 20.81 | 95.84 | 16.97 | 55.21 | 18.21 | 41.24 | 19.89 | 27.46 | Returns incomplete |
| 1848-52 | 210.31 | 19.34 | 96.85 | 15.71 | 55.58 | 17.00 | 40.81 | 18.79 | 26.51 | 62.8 (4 years) |
| 1853-57 | 198.21 | 18.15 | 91.61 | 14.77 | 52.00 | 16.04 | 37.89 | 17.91 | 24.88 | 80.2 |
| 1858-62 | 200.20 | 17.72 | 90.00 | 14.40 | 52.29 | 15.40 | 38.33 | 17.10 | 24.48 | 65.9 |
| 1863-67 | 212.84 | 17.95 | 99.09 | 14.45 | 56.51 | 15.68 | 41.45 | 17.49 | 25.97 | 76.9* |
| 1868-72 | 238.85 | 17.62 | 107.31 | 14.09 | 61.02 | 15.18 | 44.53 | 16.95 | 26.82 | 91.7 |
| 1873-77 | 211.98 | 15.99 | 94.88 | 13.23 | 53.45 | 14.50 | 39.46 | 15.97 | 24.49 | 80.0 |
| 1878-82 | 197.24 | 14.90 | 84.57. | 12.32 | 47.64 | 13.44 | 34.52 | 15.23 | 22.17 | 66.7 |
| 1883-87 | 209.62 | 12.98 | 75.70 | 11.00 | 42.24 | 12.24 | 13.39 | 19.88 | 29.9 | |
| Under 20 years | Over 20 years | |||||||||
| 1888-92** | 206.5 | 12.73 | 67.05 | 10.20 | -- | 23.28 | -- | 13.62 | 18.34 | 3.4 |
| 1893-97 | 196.0 | 11.42 | 69.31 | 10.10 | -- | 21.01 | -- | 14.29 | 17.31 | 2.1 |
| 1898-02 | 176.8 | 11.81 | 59.89 | 10.70 | -- | 19.27 | -- | 15.24 | 16.75 | 8.2 |
| 1903-07 | 153.0 | 10.09 | 43.49 | 9.64 | -- | 14.39 | -- | 13.99 | 13.78 | 23.5 |
| 1908-10 (3 years) | 127.6 | 9.74 | 33.52 | 9.45 | -- | 11.18 | -- | 13.94 | 12.30 | 11.4 |
* For the actual number of annual vaccinations and the extra vaccinations for
1863-64, see Table 50.
** The calculations for the quinquennial period of 1888-92 have been made on
the populations shown by
the Census returns for 1881.
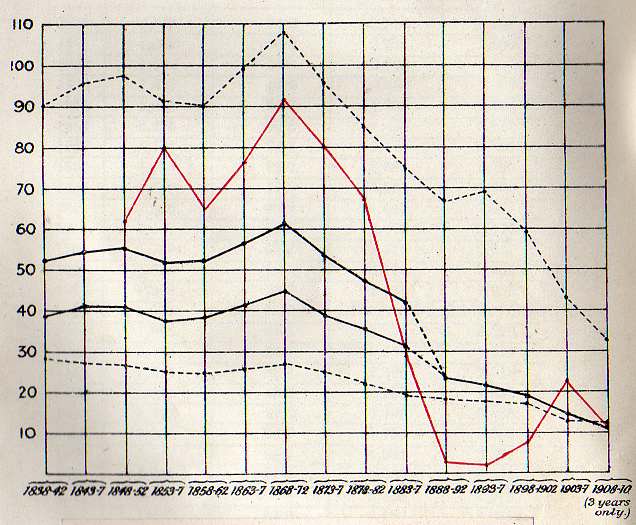
GRAPH J
ILLUSTRATING TABLE 49. (see Appendix).
LEICESTER.
DEATH-RATES UNDER 6, 10, AND 16 YEARS. AND AT ALL AGES.
After 1883-7, ages under 10 and 15 are merged into age under 20, as shown by dotted lines connecting solid curves.
Upper Dotted Curve—Average annual death-rate from all causes per 1,000 children
living under five years of age.
Upper Solid Curve.—Average annual death-rate
from all causes per 1,000 children living under ten years of age.
Lower Solid Curve—Average annual death-rate from
all causes per 1,000 children living under fifteen or twenty years of age.
Lower Dotted Curve— Average annual
death-rate from all causes per 1,000 living at all ages. Red Curve—Average annual percentage of vaccinations to total
births.
CHAPTER 48. SAVING THE CHILDREN'S LIVES.
Now, what is the logical and actual outcome of the teaching of the figures just considered? We know that one of the principal claims put forward in favour of vaccination has been that it not only saves the children from a loathsome, disfiguring disease, but that it also saves many of them from a premature death by small-pox. If there was any truth in these claims, it would be unwise to the last degree not to pay earnest heed to them. Indeed, it does credit to human nature to know that such feelings of sympathy have prompted, in no small measure, the support given to the practice of vaccination. Unfortunately for those who believe in, and press, these claims, experience not only shows their utter fallacy and complete failure, but it proves exactly the opposite result.
We have only to examine Table 49, and Graph J, illustrating this table (see Appendix), to see this most clearly.
This diagram shows—
(1) That the decline of the mortality at all ages (which had set in with the introduction of sanitary measures in the earlier periods 1848-62) was checked, and that the mortality rapidly rises (particularly in the younger ages) concurrently with the increased enforcement of vaccination.(2) That the highest death-rate of children under 5, under 10, and under 15 years (up to which ages more especially it has been assumed that vaccination saves life) was coincident with the highest rate of infantile vaccination, 1868-72.
(3) That the above-mentioned increase of mortality under 5, 10, and 15 years (the death-rates above 15 meanwhile declining) raised the all-age and all-cause death-rate to the highest point (1868-72) attained during a period of forty years from 1849, when vaccination became more generally practised in Leicester.
(4) That a notable and continuous decline in the mortality of children, more particularly in the younger ages under 5 years, with a proportionate decline under the ages of 10 and 15 years, coincides with the rapid fall and general abandonment of vaccination.
(5). That Leicester (which was formerly classed by the Registrar-General amongst the most unhealthy towns of the country) had an average annual death-rate in 1868-72 of 26.82 per 1,000 total population, when the percentage of vaccinations was 91.7 to the total births; and that subsequently, when vaccinations had fallen to 2.1 per cent, to the total births, the average annual death-rate from all causes for 1893-97 had fallen to only 17.31 per 1,000 living, and has since gone down to 12.30. (This is a remarkably low death-rate for a manufacturing town like Leicester, especially considering its geology and geographical position. It is now, therefore, grouped by the Registrar-General with towns having the lowest rate of mortality.)
The lesson of this table (49) is that when we pinned our faith to the prophylactic and saving virtues of vaccination—from 1868 to 1872—no fewer than an annual average of 239 out of every 1,000 infants born died within twelve months of their birth. Now, having seen the error of our ways, and discarded the nostrum, instead of 239 deaths, there is only an annual average of 128 deaths per 1,000 births, or a decrease of 111 per thousand, being a saving of 46 per cent. These figures represent an annual saving of over 600 infant lives each year in Leicester.
In other words, instead of 1,315 infants dying within twelve months of their birth each year, as in 1868-12, there are now only 702 such deaths. Even these are too many, but, fortunately, the trend is still in the right direction.
The saving of children's lives under five years of age is on the same lines of progress. Whereas in the high vaccination period of 1866-72 there were 107 deaths per thousand living at that age, now there are only 34 per thousand, being a decrease of 73 per thousand, or a saving of 68 per cent. This represents a saving of over 2,200 lives each year of children living under five.
In other words, if the death-rate under this heading had continued as in 1868-72, no less than 3,109 children under five years of age would have died within each year, instead of only 890. These remarkable results show us where the saving of life has been effected by our sanitary work, minus vaccination.
The preservation of life under 15 is equally remarkable, but as this age is now merged in that of twenty years, which is practically an adult age, it is unnecessary to deal with it in this chapter. I, therefore, relegate it to that on the general death-rate of Leicester.