TB incidence graphs
TB
[2009 pdf] Immunization
Graphs: Natural Infectious Disease Declines; Immunization Effectiveness; and
Immunization Dangers Prepared by: Raymond Obomsawin Ph.D.
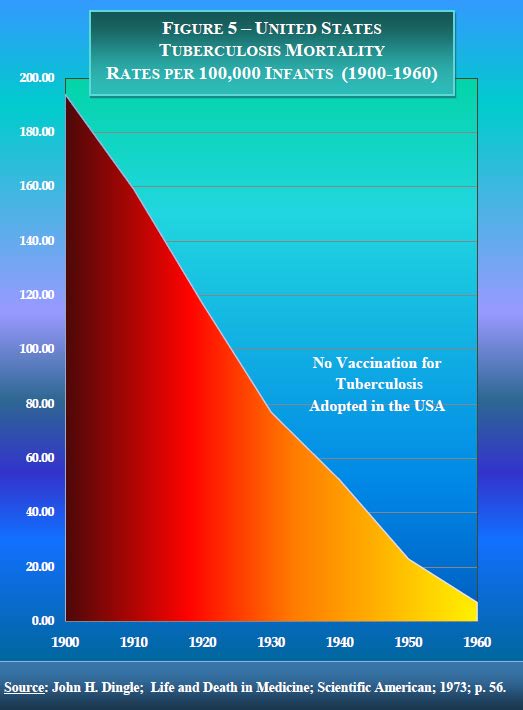
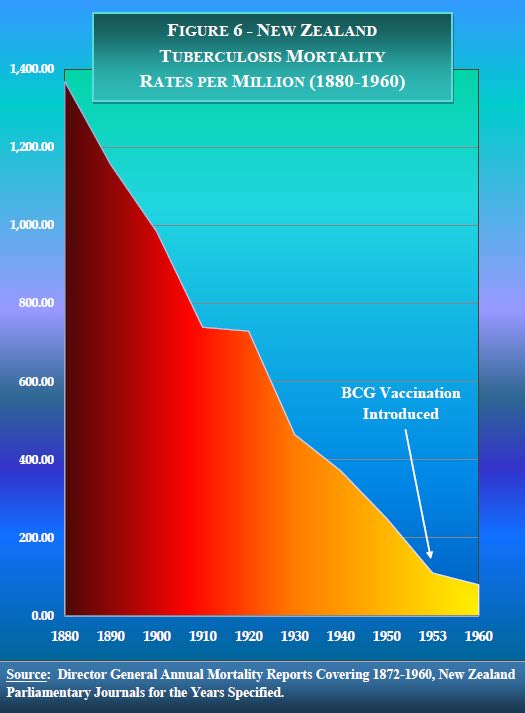
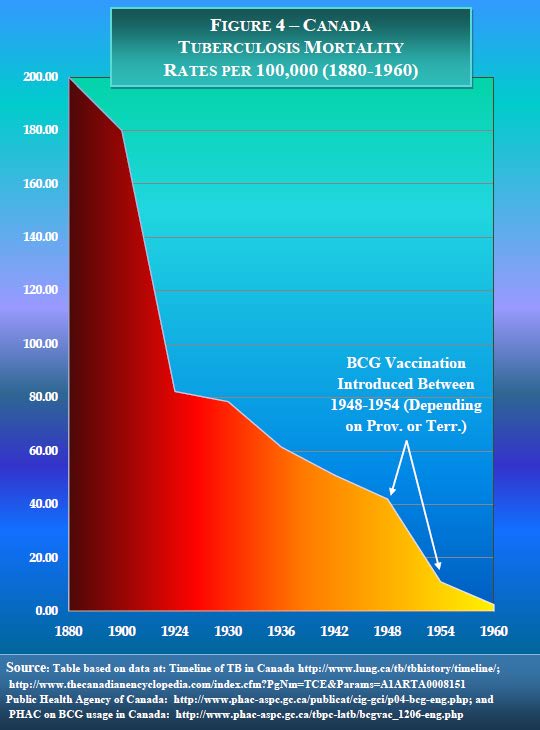
Figures one (1) through eleven (11) graphically illustrate that
in North America, Europe, and the South Pacific , major declines in
life-threatening infectious diseases occurred historically either without, or
far in advance of public immunization efforts for specific diseases as listed.
This provides irrefutable evidence that vaccines are not necessary for the
effective elimination of a wide range of infectious diseases
Figures eleven (12) through twenty-four (24) graphically
illustrate that immunization is not by any means a proven and foolproof measure
for protection from various infectious disease conditions. It is often
inconsequential epidemiologically, and in some cases it is shown to actually
worsen health-care outcomes.
Obomsawin, Ph.D,
Raymond