[back] Book: VACCINATION A DELUSION by ALFRED RUSSEL WALLACE (split into chapters)
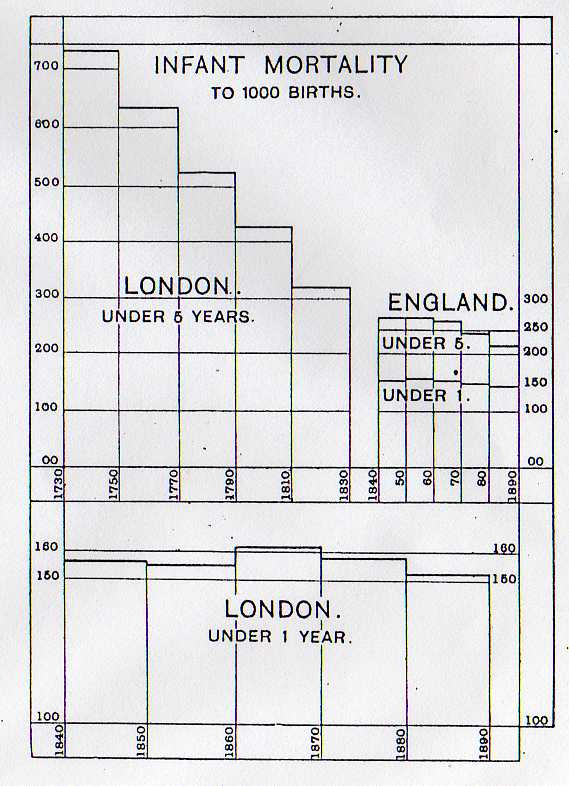
Infant Mortality.
The upper portion of this diagram shows the Infant Mortality of London from 1730 to 1830, from Dr. Farr's tables in McCulloch's Statistical Account of the British Empire, vol. ii., p. B43 (1847). From 1840 to 1890 shows the Infant Mortality of England calculated from the Reports of the Registrar-General (see 3rd Report, p. 197, Table-0). Materials for the continuation of Dr. Farr's London Table (under 5 years) are not given by the Registrar-General.
The Lower part of the Table shows, on a larger scale, the Infant Mortality of London, under one year, as given by the Registrar-General in his Annual summary for 1891, Table 12, p. xxv., and in his 68th Annual Report, Table 25, p. xci.