[back] Book: VACCINATION A DELUSION by ALFRED RUSSEL WALLACE (split into chapters)
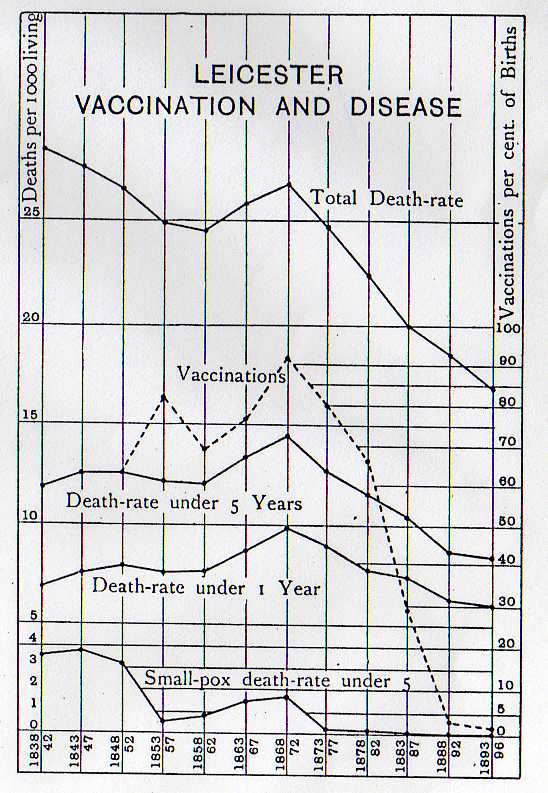
This Graph shows various Death-Rates in Leicester, in five-year Averages.
The dotted line shows the percentage of vaccinations to total births.
Authorities.
The three Death - rates and the Vaccinations are from Table 34 (p. 450) in the Fourth Report.
The Small-pox death-rate is from Table 45 (p. 461) in same Report.
Figures to continue the diagram to 1896 have been kindly furnished by Mr. Biggs from official sources.